<- fec16:: results_house |> select (- runoff_votes, - runoff_percent, - footnotes) |> mutate (district = parse_number (district_id)) |> group_by (state, district) |> summarize (N = n (), total_votes = sum (general_votes, na.rm = TRUE ),d_votes = sum (ifelse (party == "DEM" , general_votes, 0 ), na.rm = TRUE ),r_votes = sum (ifelse (party == "REP" , general_votes, 0 ), na.rm = TRUE ),.groups = "drop" |> mutate (other_votes = total_votes - d_votes - r_votes,r_prop = r_votes / total_votes, winner = ifelse (r_votes > d_votes, "Republican" , "Democrat" )<- district_elect |> filter (state == "WI" )<- fec16:: results_house |> select (- runoff_votes, - runoff_percent, - footnotes) |> filter (state == "WI" ) |> filter (district_id == "03" )
# A tibble: 2 × 10
  state district_id cand_id   incumbent party primary_votes primary_percent
  <chr> <chr>       <chr>     <lgl>     <chr>         <dbl>           <dbl>
1 WI    03          H6WI03099 TRUE      DEM           33320           0.812
2 WI    03          H6WI03164 FALSE     DEM            7689           0.187
# ℹ 3 more variables: general_votes <dbl>, general_percent <dbl>, won <lgl>
Wisconsin District 3 had 2 democrats running for the house seat.
<- st_read ("https://jadenchant.github.io/data/wisconsin_districts.gpkg" )
Reading layer `wisconsin_districts' from data source
  `https://jadenchant.github.io/data/wisconsin_districts.gpkg'
  using driver `GPKG'
Simple feature collection with 8 features and 16 fields
Geometry type: MULTIPOLYGON
Dimension:     XY
Bounding box:  xmin: -92.88811 ymin: 42.49198 xmax: -86.80542 ymax: 47.08062
Geodetic CRS:  NAD83
<- districts |> st_transform (4326 ) |> inner_join (wi_results, by = c ("DISTRICT" = "district" ))<- ggplot (data = wi_merged, aes (fill = winner)) + annotation_map_tile (zoom = 7 , type = "cartodark" , progress = "none" ) + geom_sf (alpha = 0.4 , color = "white" , size = 0.2 ) + scale_fill_manual ("Winner" , values = c ("Democrat" = "#2E5B88" , "Republican" = "#8B1A1A" )) + geom_sf_text (aes (label = DISTRICT), color = "white" , fontface = "bold" , check_overlap = TRUE ) + ggtitle ("Wisconsin House Winners by District" ) + labs (x = NULL , y = NULL ) + dark_theme_gray (base_size = 12 ) + theme (axis.ticks = element_blank (), axis.text = element_blank (), panel.grid = element_blank (),plot.margin = unit (c (0.2 , 0.7 , 0 , 1.5 ), "cm" )|> select (- state)
# A tibble: 8 × 8
  district     N total_votes d_votes r_votes other_votes r_prop winner
     <dbl> <int>       <dbl>   <dbl>   <dbl>       <dbl>  <dbl> <chr>
1        1     7      353990  107003  230072       16915  0.650 Republican
2        2     2      397581  273537  124044           0  0.312 Democrat
3        3     2      257401  257401       0           0  0     Democrat
4        4     4      285858  220181       0       65677  0     Democrat
5        5     3      390507  114477  260706       15324  0.668 Republican
6        6     4      356935  133072  204147       19716  0.572 Republican
7        7     4      362061  138643  223418           0  0.617 Republican
8        8     4      363574  135682  227892           0  0.627 Republican
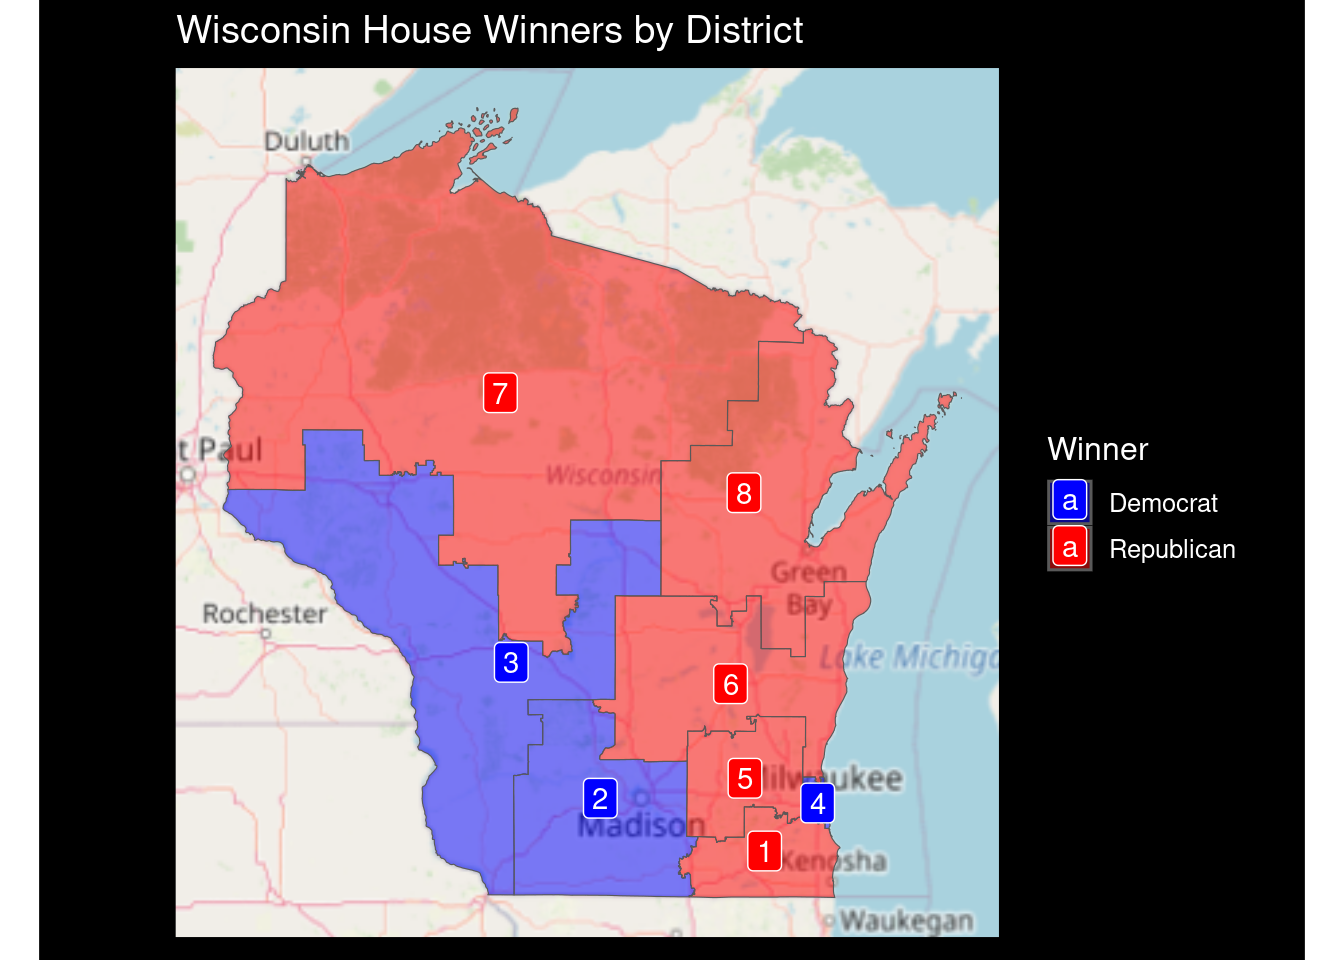
The map shows the winners of the 2016 House elections in Wisconsin. The district shapes are very irregular. District 4 is extremely small when compared to district 7. There are 2 districts where there isn’t even a republican running. The races where republicans have won the district, they have won by a small margin. However, the margin is not as small as the North Carolina districts that we looked at in class.